Heidi Selberg, Envision Board Member
Recent news reports about the changes in the racial composition of the US and their relation to the race/ethnicity questions on the census form have generated some confusion. Are the reported changes in the country’s racial composition a real transition, or are they simply a result of the change in the way the questions were worded? Let’s find out.
Here’s what’s the same in both census questionnaires (2010 and 2020):
- Race and Hispanic origin continue to be two separate questions despite some researchers’ recommendation to combine them. This might continue to be debated in the future.
- Respondents can select one or more race categories.
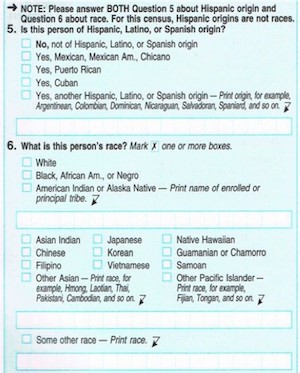
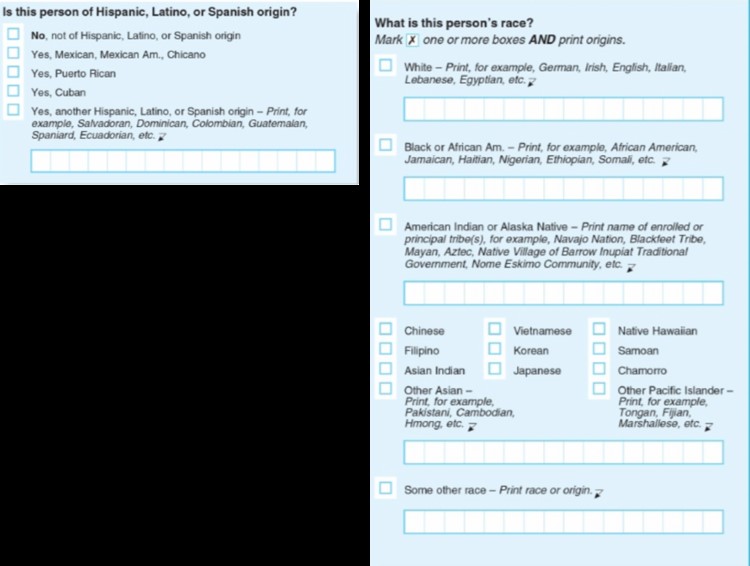
Here’s what was different (see illustrations of 2010 and 2020 questions below)
- In the Hispanic origin question, the example groups were revised from “Argentinean, Colombian, Dominican, Nicaraguan, Salvadoran, Spaniard, and so on” to “Salvadoran, Dominican, Colombian, Guatemalan, Spaniard, Ecuadorian, etc.” in order to represent the largest Hispanic-origin population groups and the geographic diversity of the Hispanic or Latino category.
- The instructions were slightly reworded from “Print origin, for example” to “Print, for example.”
- Respondents in 2020 had an opportunity to provide more detail for the “white” and “black” race categories.
- The instruction for “white” asked respondents to “Print, for example, German, Irish, English, Italian, Lebanese, Egyptian, etc.”
- The instructions for “black” asked respondents to “Print, for example, African American, Jamaican, Haitian, Nigerian, Ethiopian, Somali, etc.”
- Additional instructions were included for American or Alaska Natives.
- Rather than simply asking respondents to print the name of enrolled or principal tribe, it provided examples: “Print the name of enrolled or principal tribe, for example, Navajo Nation, Blackfeet Tribe, Mayan, Aztec, Native Village of Barrow Inupiat Traditional Government, Nome Eskimo Community, etc.”
- The Asian and Native Hawaiian or Other Pacific Islander checkboxes were reordered.
- “Guamanian or Chamorro” was changed to “Chamorro.”
- Some other instructions were worded differently: From “Mark one or more boxes” to “Mark one or more boxes AND print origins” and from “Print race” to “Print race or origin.”
So, what were the results? The Census Bureau has developed a resource to help us visualize changes in demographic composition. It calculates a “diversity index” for states and counties. The interactive map can be accessed here.
And here’s another good article I recommend: Levy, Morris et all. “The Truth About White America,” The Atlantic, October 25, 2021.
The diversity index measures the probability that two people, chosen at random, will be from different race and ethnicity groups. Here are some sample comparisons:
| Location | 2010 Diversity Index | 2020 Diversity Index |
| United States | 54.9% | 61.1% |
| Wisconsin | 29.8% | 37% |
| Brown County | 29.1% | 38.5% |
| Milwaukee County | 61.7% | 66.8% |
| Peppin County (least diverse WI county in 2010) | 4.3% | 11.8% |